

Click the image above to open the mapping tool in a separate browser tab. Keep this page open to read the hints and tips in the next section.
Hints and tips
The first things to note are the two green tabs at the top left. The page opens at the ‘My House’ tab by default.
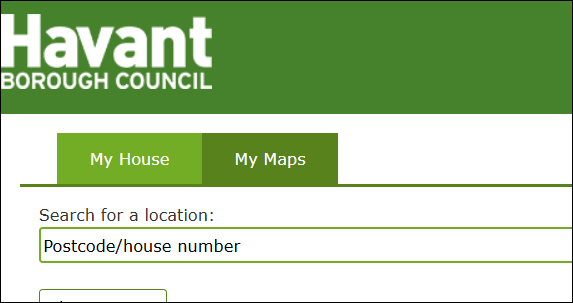
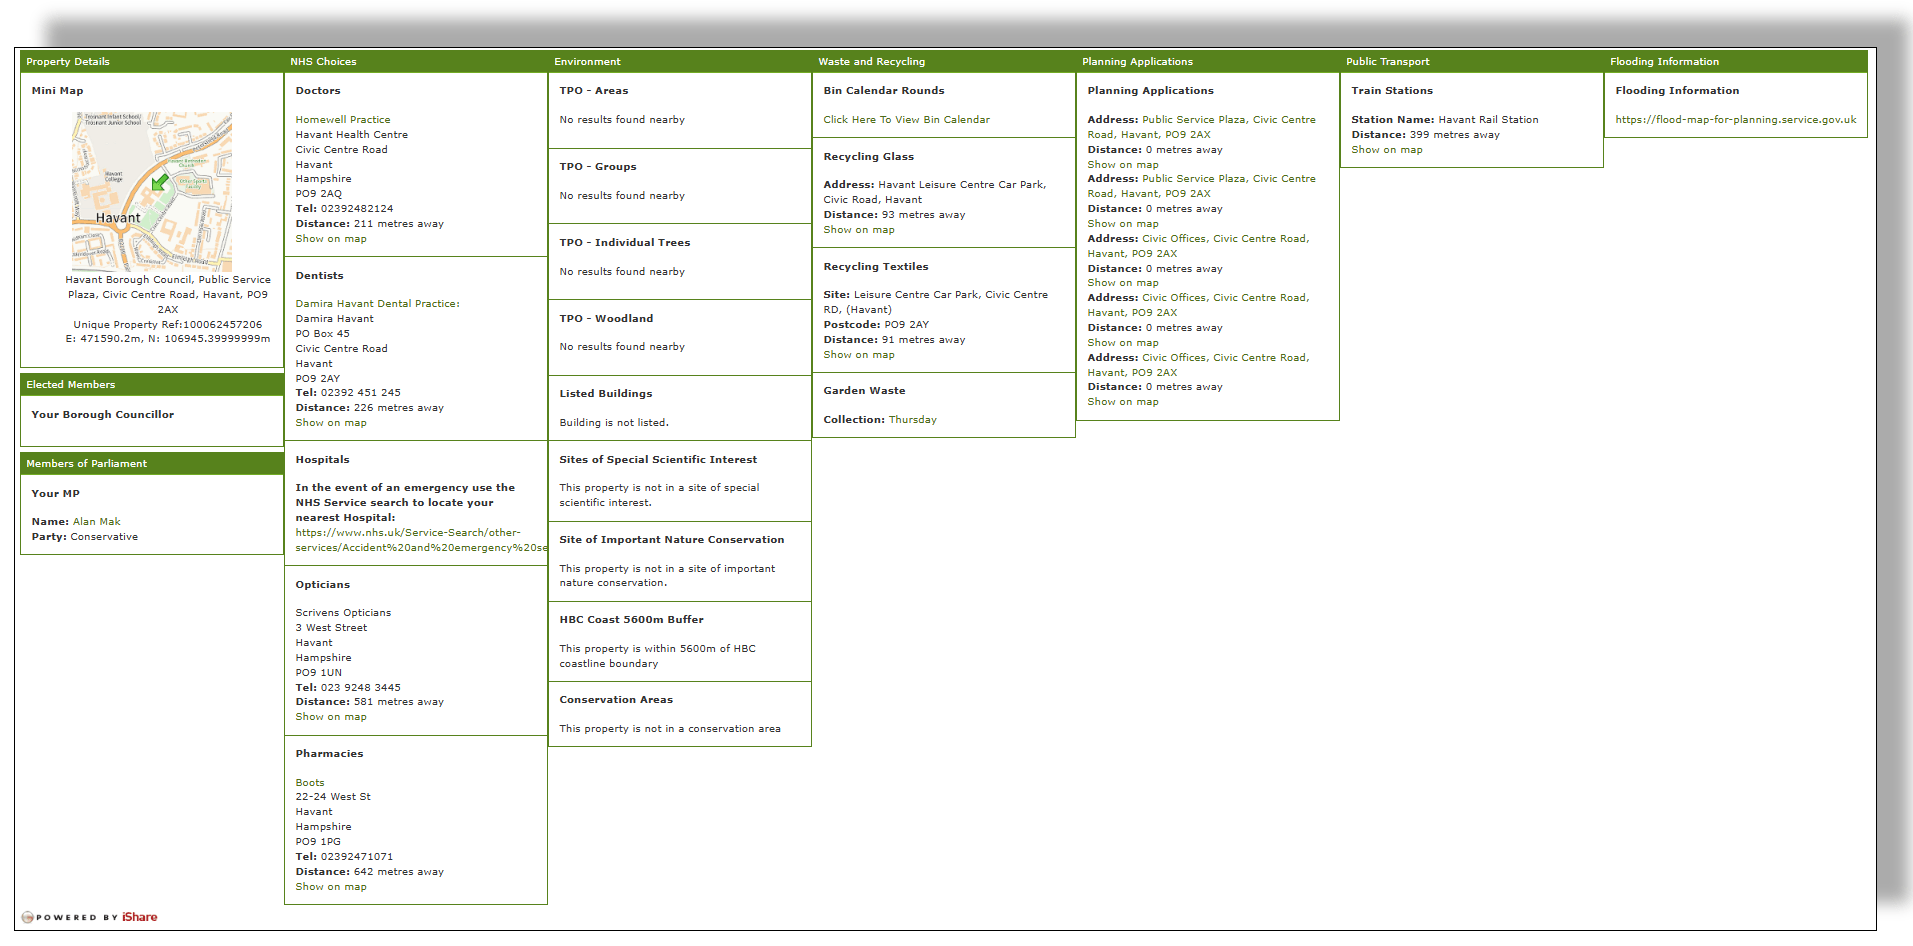
If you enter your home detail – postcode and house number and press ‘Find’, you’ll find a display like the one shown below, summarising some of the data mapped from HBC data sources which is applicable to the vicinity of your property.
The Map view
Select the ‘My Maps’ tab to open up the map browser which is where the most interesting detail can be found. Note the three elements outlined in red on the image below.
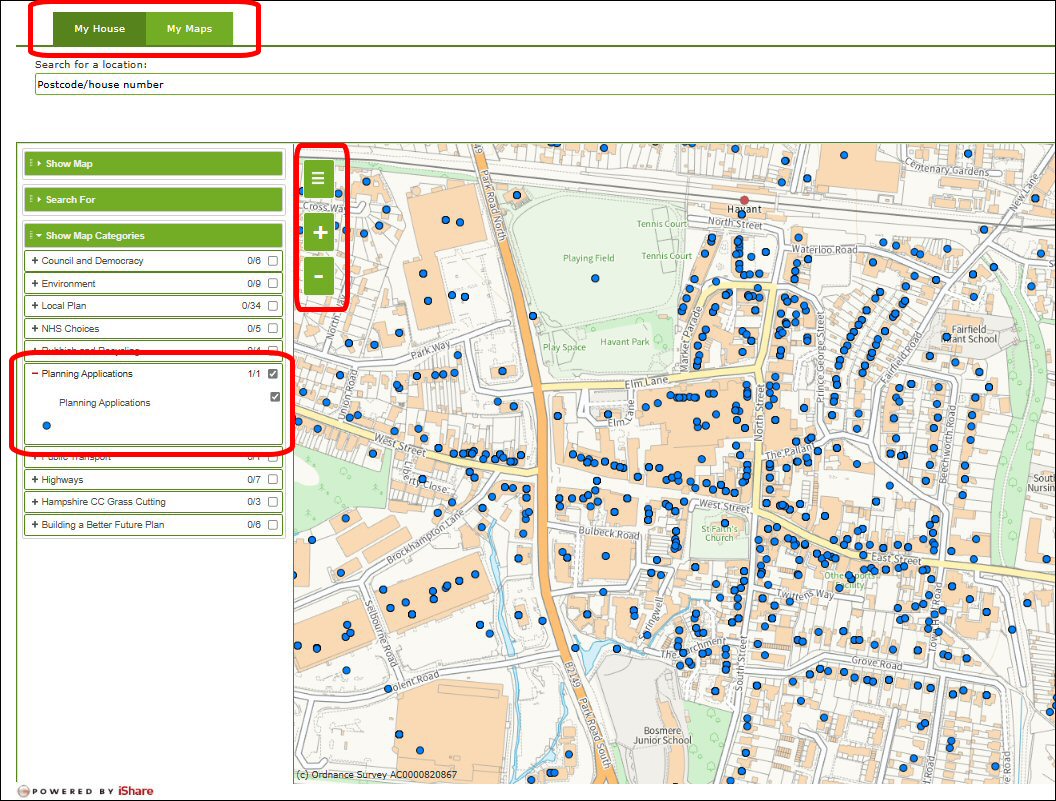
At the top, the two tabs which allow you to toggle between property view, ‘My House’, and map view, ‘My Maps’.
The left hand panel gives a list of selection criteria, opened in this example at ‘Planning Applications. Expand each heading by clicking the ‘+’ symbol to the left of the heading to show the specific data elements which can be displayed. You can select multiple criteria.
At the top left hand corner of the map pane, there are three vertically stacked icons. At the top of this group, a green ‘hamburger’ icon allows you to toggle the criteria selection menu on or off. Once you’ve made your criteria selections, toggle this icon off to maximise the area of the map shown. Clicking on the ‘+’ or ‘-‘ icons will zoom the map in or out.
The tool is quite intuitive and works surprisingly well on both mobile and desktop devices. Scrolling and zooming takes a little getting used to and the best way of becoming familiar with it is simply to dive straight in and use it.
Navigation hints
With a keyboard and mouse:
‘Shift’ and ‘scroll’ with the mouse wheel to zoom in and out of the map
‘Ctrl’ and ‘scroll’ to increase or decrease the browser page area and font size
‘Hold left button down’ on the map to drag the map around
‘Left click’ on map to item – for example the blue dots in the example below – to open a text box with details
With a touch screen:
Standard ‘pinch’, ‘zoom’ and other gestures seem to work well.
Data currency and history
A word about data currency and history. The provision of the data feeds to the service supplier leave room for improvement. Looking at the lamentable lack of protected trees in Havant Town park, the only tree shown is the fine example on the corner of Park Road South and Elm Lane, brought down by Storm Eunice on February 18, 2022.
Planning system data is rather more current though still probably updated on an ad hoc basis. With a little thought, increasing the frequency of updates to monthly and adding ‘planning application status’ as a selection criteria, this would become a really useful resource. It is interesting to note that the planning history stretches right back to the 1990s and the number of individual properties in the borough for which planning history exists over the past thirty years becomes clear as you zoom into the map.
