Update – 29 November
Given by the number of hits this post has already had from social media, and the typical TL;DR reaction, blaming ‘the council’, most people don’t have the time to get beyond the first photograph, missing the bigger picture.
Havant Borough Council has no obvious responsibility here. The bridge itself – including its brickwork – belongs to Network Rail. The car park is privately owned. The roadway running over the bridge is managed by Hampshire County Council. So if a brick were to fall onto your parked car – or, far more seriously, onto someone’s head – where would the insurance liability actually rest?
Where Havant Borough Council might have some accountability is in its role as the planning authority. By granting permission for development schemes that increase traffic volumes and vehicle weights across the bridge, the Council may be indirectly contributing to the risks borne by the structure.
There’s been much written about the state of the ageing railway footbridge between Elmleigh Road and the south side of Havant Station but rather less about the rather older road bridge which carries Park Road North over both the London and the south coast railway lines.

If you’ve recently been shopping in the Central Retail Park, you might be wondering what’s going on with these newly installed yellow barriers.
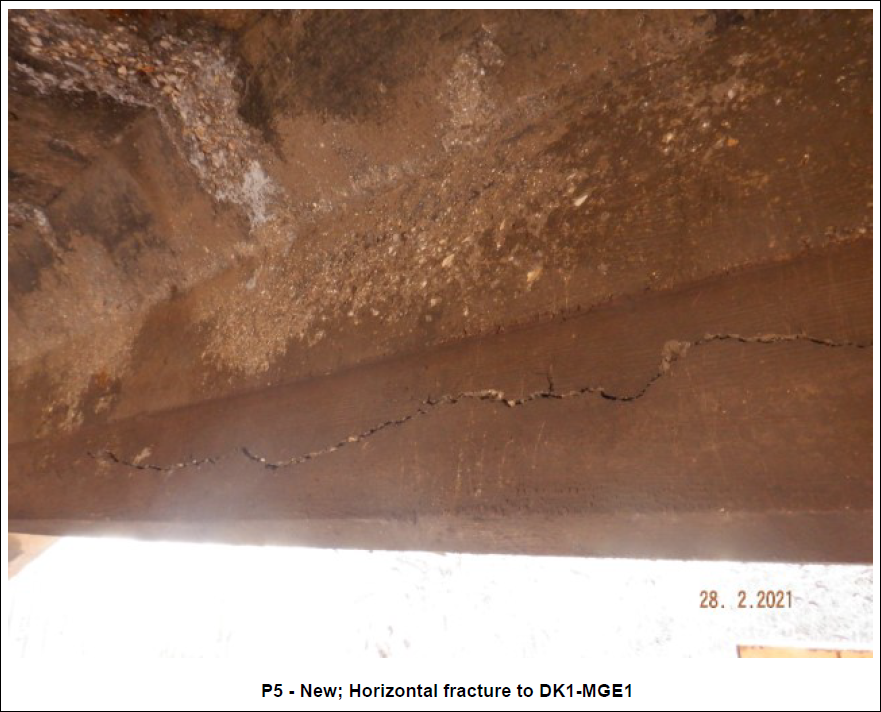
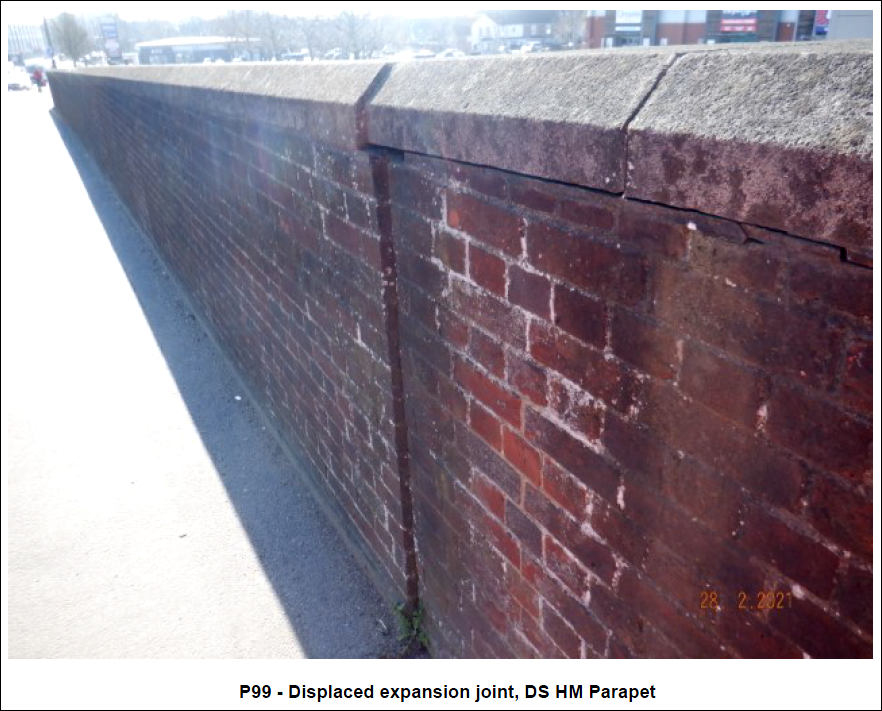
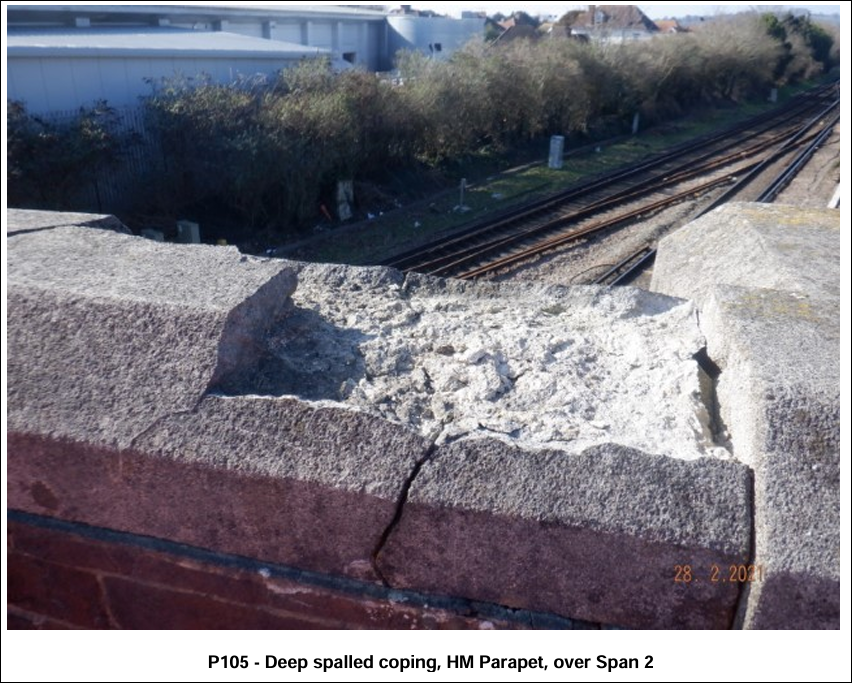
Next time you’re there, take a closer look at the brickwork on the ‘wingwall’ of the bridge above the six fenced off parking bays.
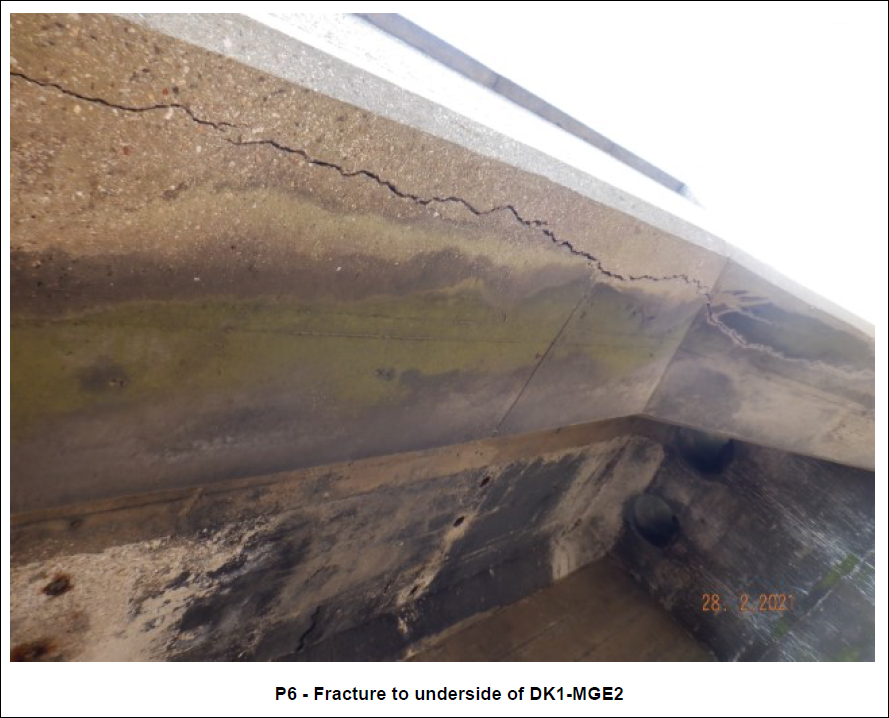
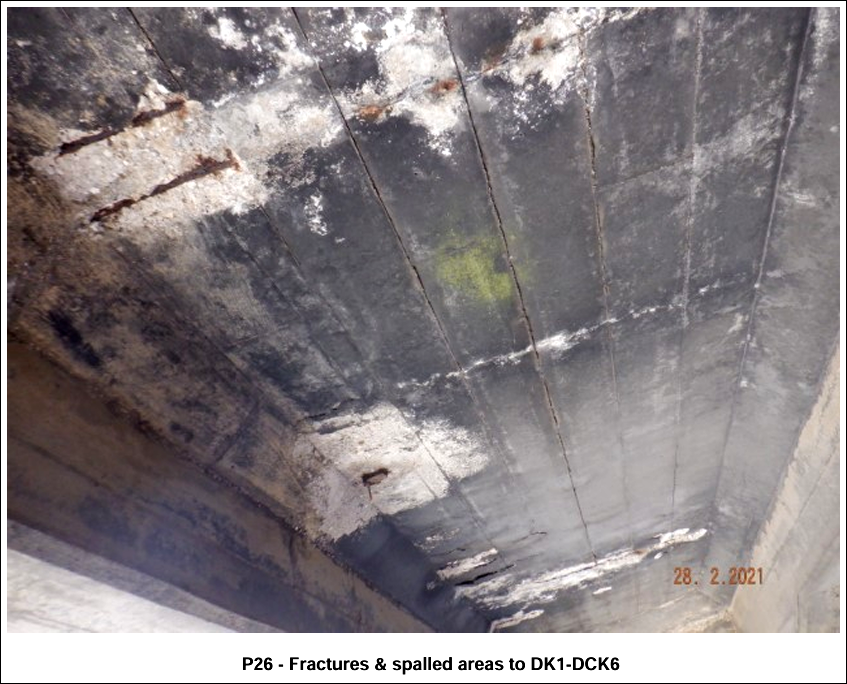
There are a few more concerning pictures from a recent inspection commissioned by Network Rail below, but first, let’s think about how the load on the bridge has changed since it was built.
Park Road North, New Road and the Park Road North railway bridge were constructed in the 1930s, during the interwar period when Havant Urban District Council was reshaping the town for motor traffic and suburban expansion. In those days, the council used to build the road infrastructure before the housing and commercial development, a seemingly obvious approach which is sadly no longer current practice.
The bridge first appears on the Ordnance Survey revision from 1940, with Park Road North – now Petersfield Road – extending north toward the village of West Leigh:
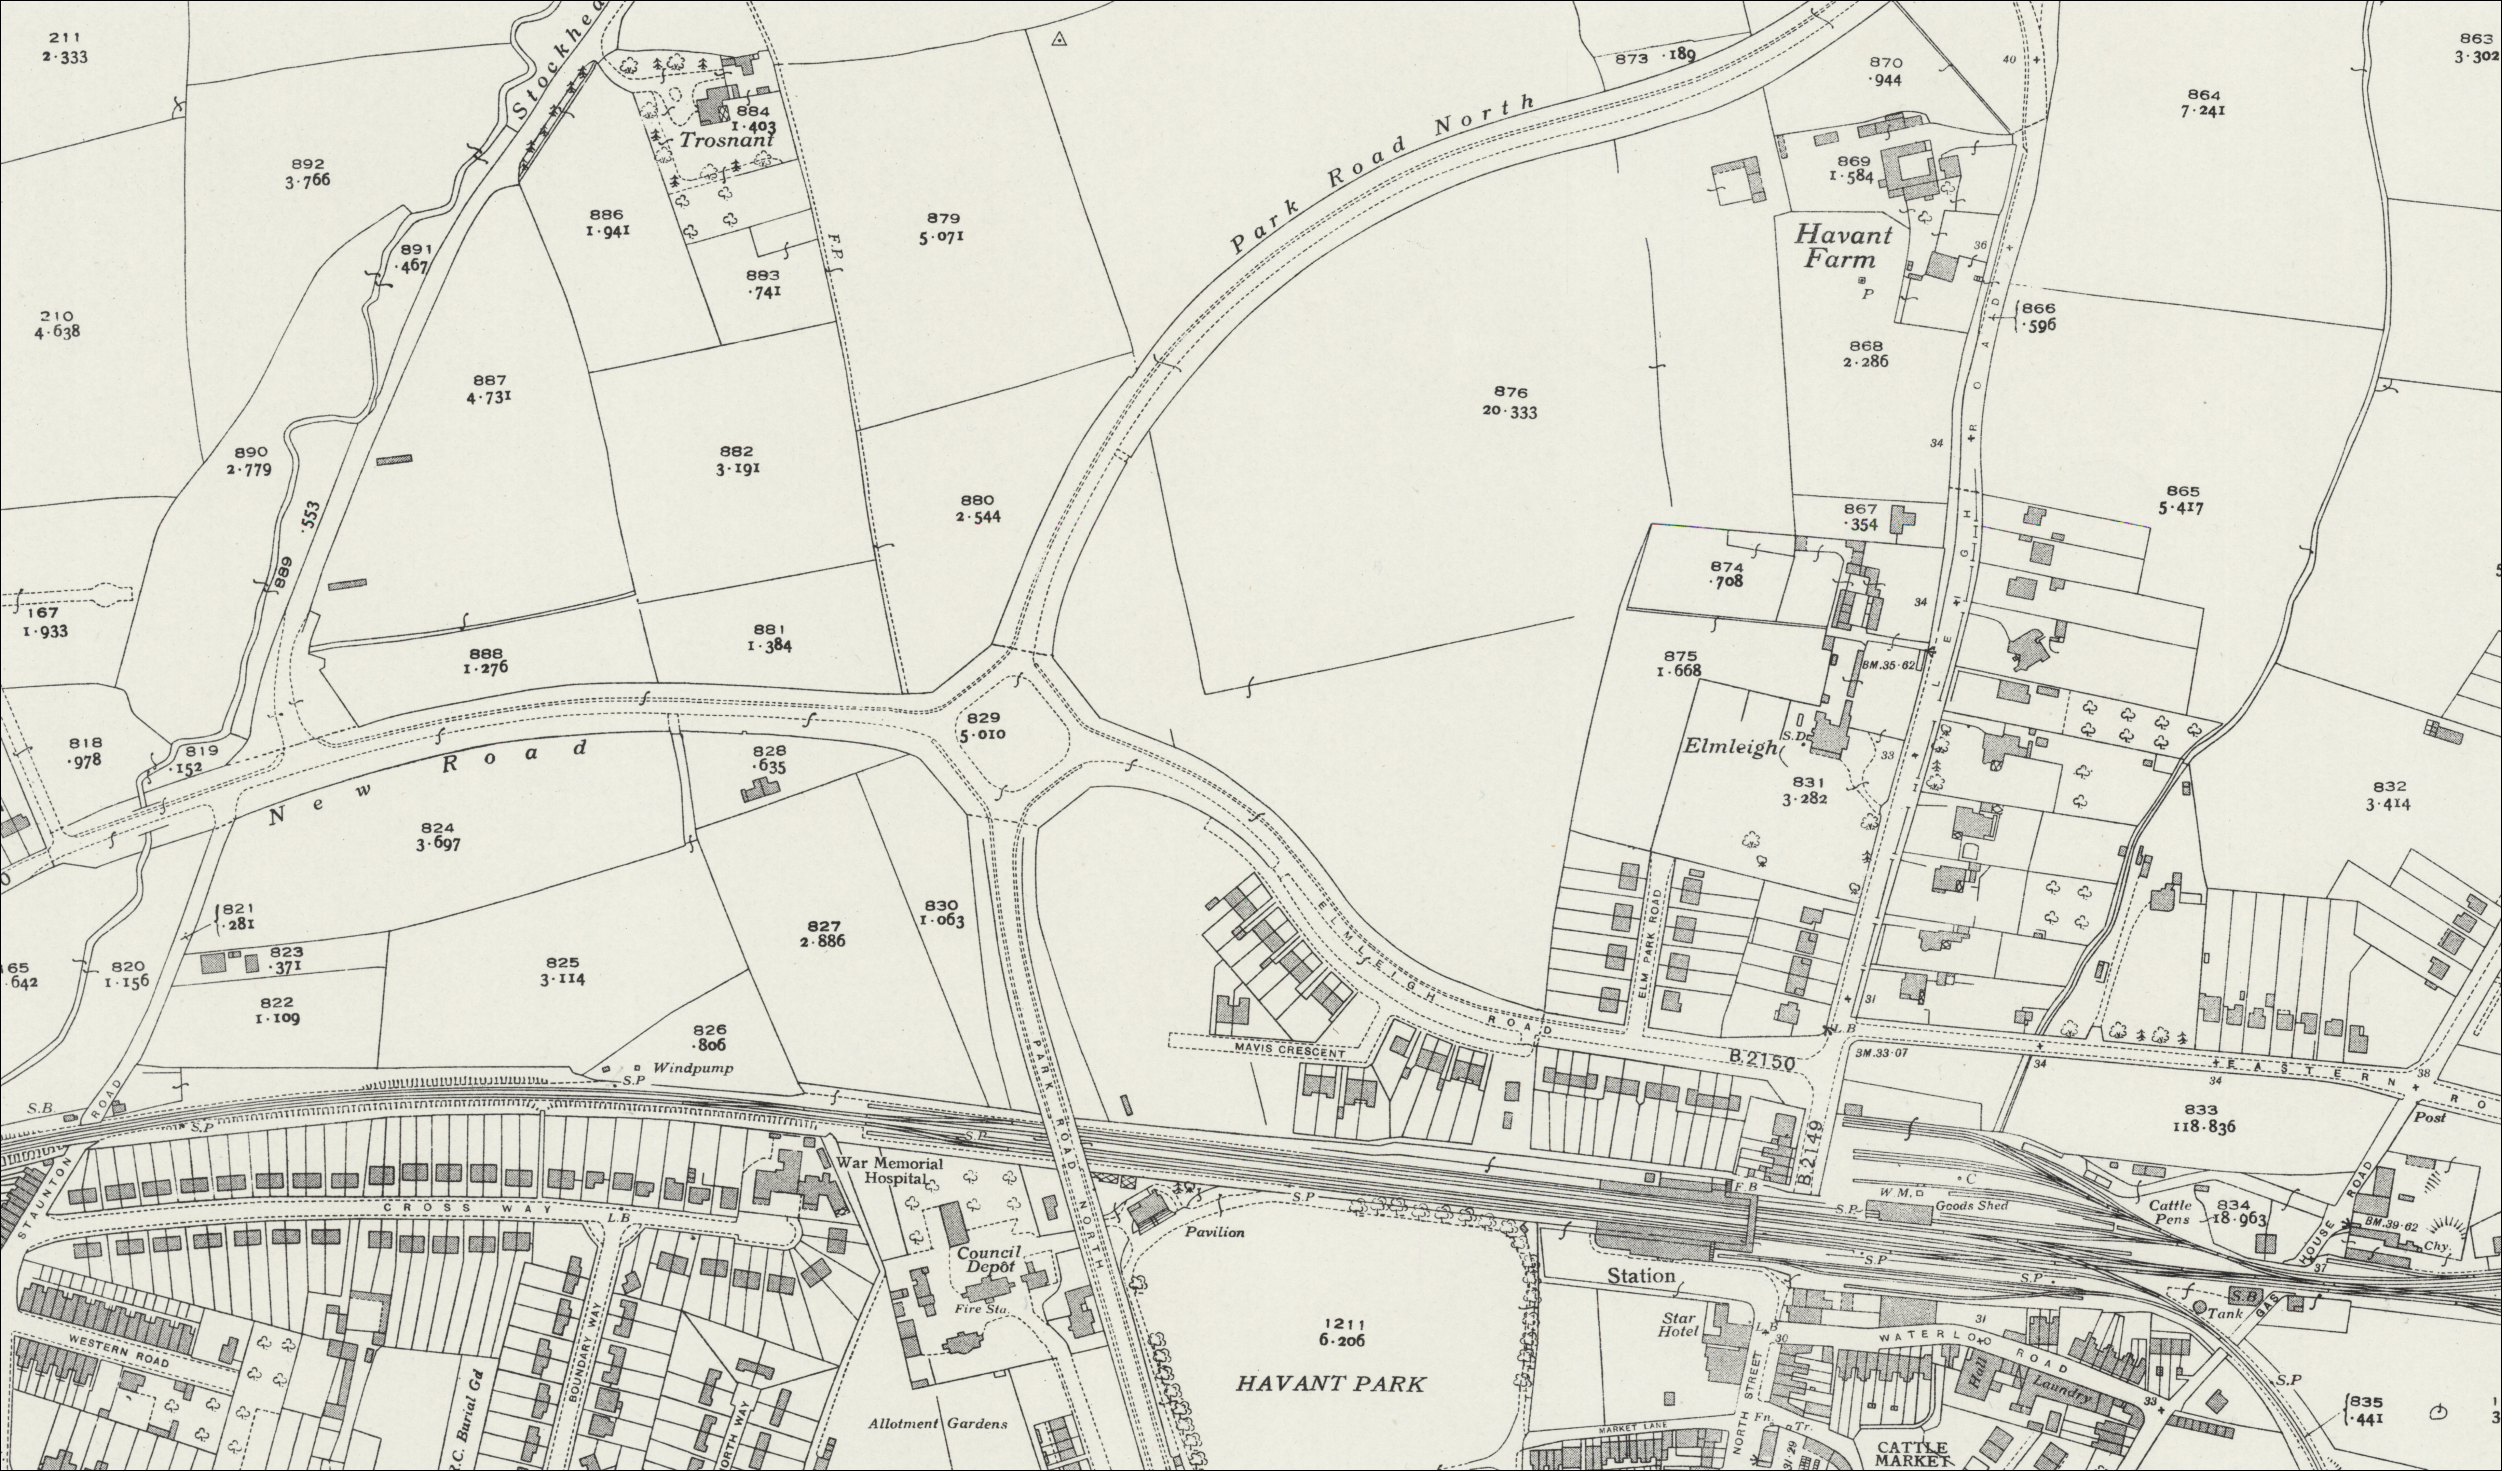
As far as we can tell, the Park Road bridge dates from around 1938 which would put it around 87 years old meaning that the structure is a few years older than the rusting wreck of a footbridge over the station.
At the time it was constructed, there were far fewer cars on the roads, and the goods yard north of the station marked on that map is a reminder that most heavy freight came into the town by rail. As the town grew, with Leigh Park House, Leigh Park Farm and Middle Park Farm demolished to make way for the new Leigh Park housing estate, Havant town stretched to the north.
West Leigh House and West Leigh Road were demolished to make way for Bartons Road and the new residential estate of West Leigh, providing homes for the employees of companies moving their manufacturing businesses into the northern end of New Lane. The bridleway, which in 1940 linked Park Road North with New Lane, became Crossland Drive and by the 1970s, Havant’s West Leigh workforce was building everything from food mixers to petrol pump hoses, hi-fi loudspeakers to tins of SMA baby formula. It’s worth bearing in mind that most of the West Leigh workforce walked to work, cycled or took public transport and as the chart below suggests, the volume of traffic on Havant’s roads would still have been relatively low.

The graph suggests that there has been more than a ten-fold increase in traffic since the bridge was built. Not only has the volume of traffic increased, but the average weight of vehicles in the UK has increased significantly from the 1930s to the 2020s. Cars in the 1930s – 1950s typically weighed 700 – 1,000 kg, while modern cars average 1,500 – 2,000 kg, with SUVs and electric vehicles pushing the weights even higher. Heavy goods vehicles (HGVs) have also grown in size and weight, with maximum legal limits rising from around 20 tonnes in the 1950s to 44 tonnes today.

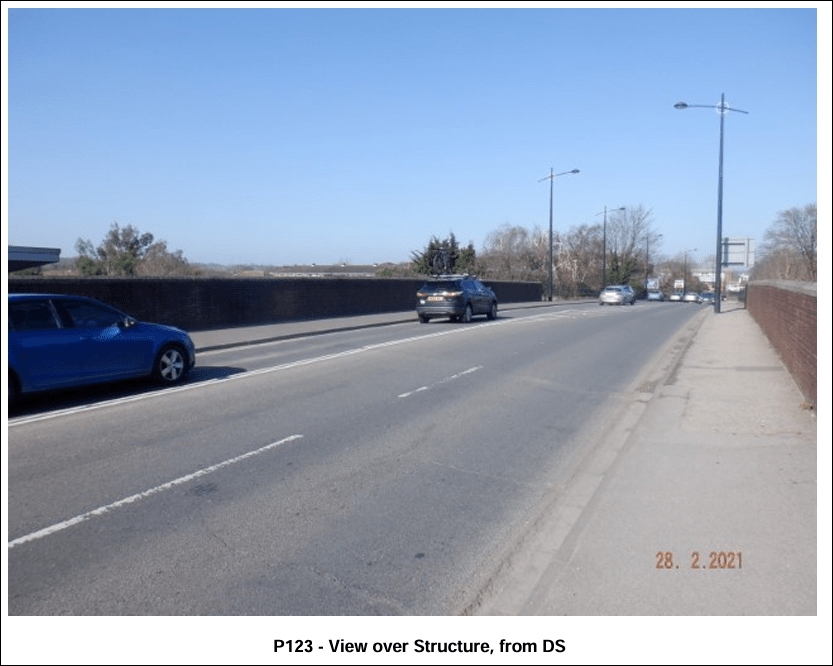
To cope with the increased volume, some readers may recall that a decade or more ago, the roadway above the bridge was re-aligned, adding a third lane to the Park Road North traffic as shown quite clearly in the following Covid era photograph from a Network Rail bridge condition survey.
Correction/Clarification – Four days after we first published this article, we received the following fascinating update from the engineer who designed the original changes for HCC:
“The work carried out in 2014 to create the three lanes on Park Road North had nothing to do with additional capacity. HCC wanted to create a safer off-carriageway cycle route and to that end the west side footway was widened from 1.8m to 2.5m.
With the original, narrower footway, although the road was marked as two lanes those lanes were wide enough (just about) to take two cars in each lane side by side in congested conditions. But what we were finding was that in uncongested conditions drivers were using the wider lanes to overtake, and when two opposing vehicles reached the blind summit of the bridge there were many collisions – not major, but wing mirror sort of level. By widening the footway to 2.5m this meant that the two wide lanes had to be narrowed, and in the design phase we realised that by changing it to a 2+1 configuration, with the switch at the bridge, this avoided vehicles meeting head on (due to the transition hatching) and added controlled capacity in new longer two-lane junction approaches at both ends of Park Road North. It’s a relatively common measure taken nowadays in highway link design, removing the uncertainty for drivers caused by the ‘is it or is it not wide enough’ conundrum.
In the ‘old’ layout you sometimes actually had 4 lanes of queueing traffic on the bridge deck, so the current arrangement regulates traffic much better and if anything potentially reduces overall deck loading.”
HCS raised a Freedom of Information request in April 2025, seeking an explanation of how the loading on the bridge from roadway traffic is monitored and measured and asking for a copy of the most recent, detailed report into the condition of the bridge. A small selection of the 130 photographs in the report are shown above, and in the slideshow, below.


In our FOI request, we focused on a couple of detailed points:
Information request: “The roadway was modified from two lanes to three lanes within this time period, but recent increases in traffic volume have led to an increase in the frequency of traffic queuing on the bridge. If not contained within that report, please confirm the maximum vehicle weight that the bridge should carry, and whether the load on the bridge structure from static vehicles differs from that of vehicles in steady motion.“
The Network Rail Response seemed reassuring:
“The most recent assessment, carried out in 2016, confirmed that the bridge is capable of carrying a maximum vehicle weight of 40 tonnes. The assessment process already accounts for differences in loading between static and moving vehicles, and no concerns have been identified in relation to the current or increased frequency of traffic queuing on the bridge.“
Information request: “If not contained within that report, what is is Network Rail’s assessment of the likelihood that a requirement could occur which restricts road loading on the bridge, for example by alternate traffic signalling, for the duration of essential maintenance activity.”
The Network Rail Response skirted round the ‘likelihood’ request:
“If maintenance works are required that could affect the bridge’s capacity or safety, a temporary road restriction may be applied for through the relevant local council or highways authority. The suitability and details of any such restriction would be discussed and agreed upon as part of that process.”
We looked at the report and noted the obvious discrepancy. The full report describes the structure as:
“… a 2x span bridge with concrete decks and beams, supported by concrete Abutments, Piers and brickwork Wingwalls. Carrying two lane road over 2x electrified lines, on the WPH2 route”
So we then made a supplementary request:
Supplementary request: “The road was converted to a three lane road some time before 2021, so we would be grateful if you could verify whether the description of it as a ‘two lane road’ has any bearing on the load calculations. Clearly a three lane road carries potentially 50% greater load than the two lane road that the bridge was originally designed to carry. We would also appreciate a comment from an engineer as to whether load calculations have been revised in the light of the increased frequency and weight of electric vehicles.”
We had three attempts at chasing a response and when it finally came it didn’t seem particularly convincing:
Network Rail Response:
“I can confirm that the construction of the bridge is such that whether it carries a two-lane carriageway or is increased to three-lanes does not affect its ultimate load-carrying capability. The structural design accommodates the overall loading applied to the bridge, not the number of marked traffic lanes. Additionally, the bridge has sufficient capacity to cater for any increased frequency and weight of electric vehicles.”
This leaves questions still unanswered. For example, why did the FOI response reference the 2016 assessment rather than the later 2021 inspection document that it enclosed? The question of whether the recommendations from that later assessment have been implemented also needs to be asked.

Perhaps the subsequent installation of these barriers outside Aldi provides the response. In any event, the bridge is clearly in a poor state of maintenance and appears well overdue the kind of fundamental renovation work which will undoubtedly constrain the flow of traffic across the bridge in both directions.
If the approach to the Langstone A27 junction from the north is looking a little shaky these days, it’s not alone. Our colleagues on Hayling Island have been drilling into the health of the A3023 bridge which provides their only connection with the mainland. While that bridge is at least twenty years younger than the Park Road North bridge, its state is, if anything, worse.
Major works to either bridge will be extremely disruptive.
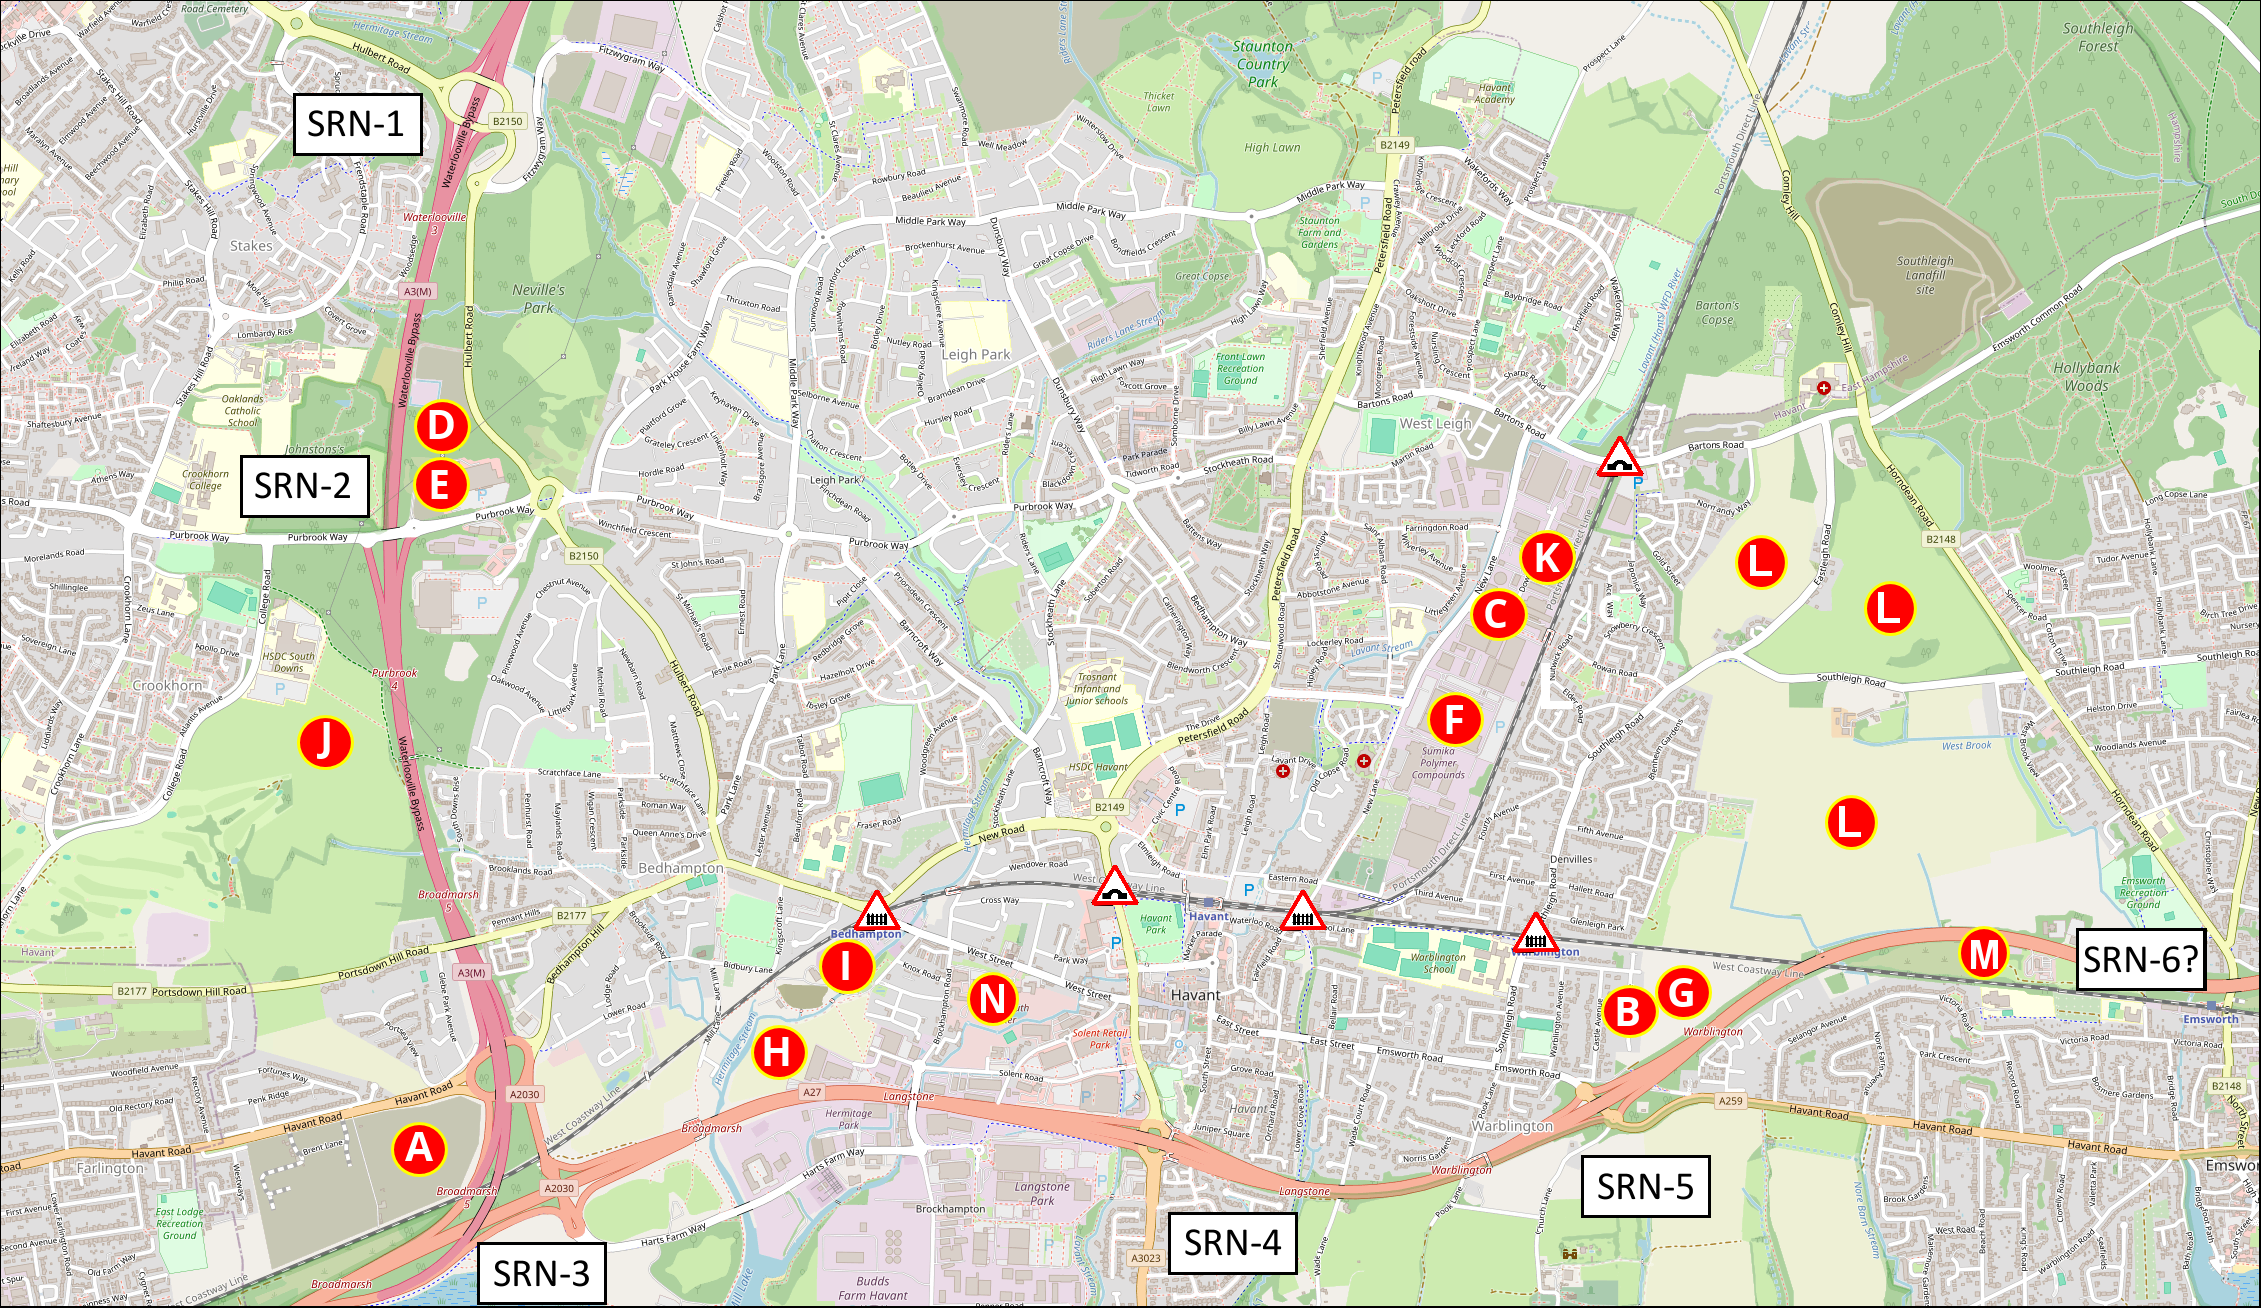
The A27 Langstone roundabout junction is just one of five strategic road network junctions on which Havant depends. We’ll be discussing these in greater detail in a forthcoming post.